Note: A selection of materials from the Jenks collection, including the items shown here, were exhibited in the library’s North Gallery in June-July 2018. An online version of the exhibit is now available.
This past semester I helped process the George F. Jenks Map Collection under the guidance of Spencer Special Collections Librarian Karen Cook. Jenks (1916-1996) taught in KU’s Geography Department from 1949 to 1986, and during his tenure he established a renowned cartography program and became internationally recognized as a preeminent cartographer and scholar. The collection is composed of hundreds of maps, graphics, and associated artwork that he produced for publication and in support of his research. In this post I highlight a few items from the collection to illustrate the scope of Jenks’ career.
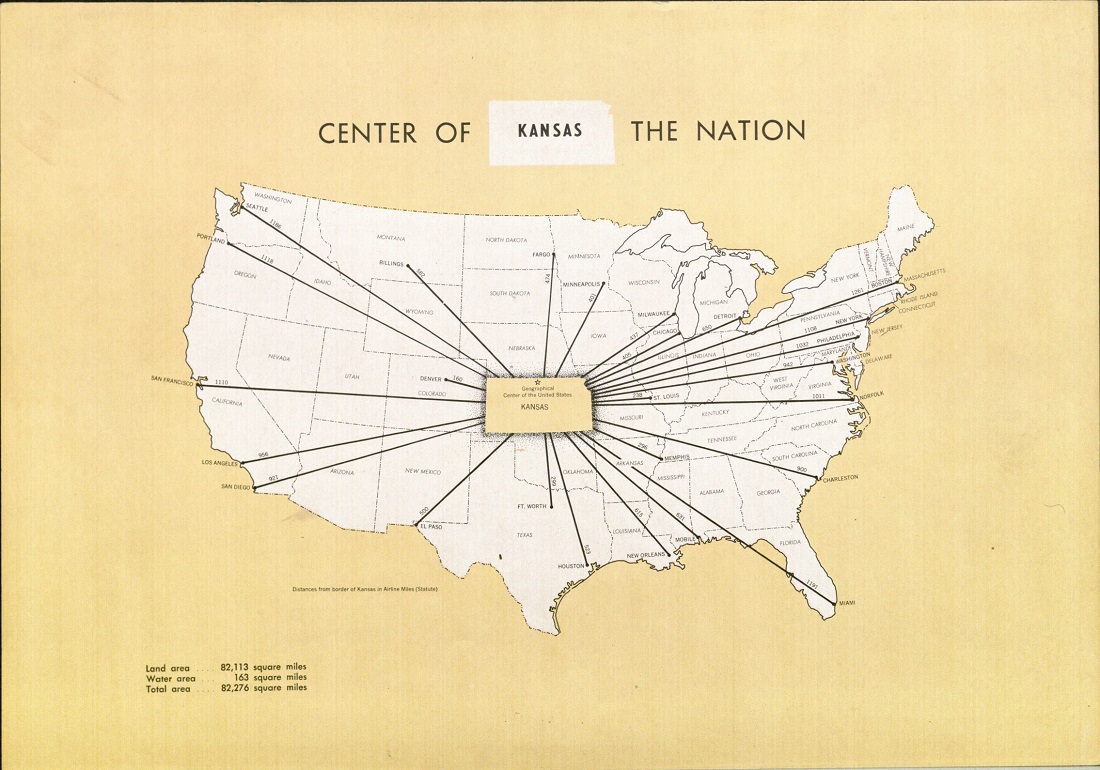
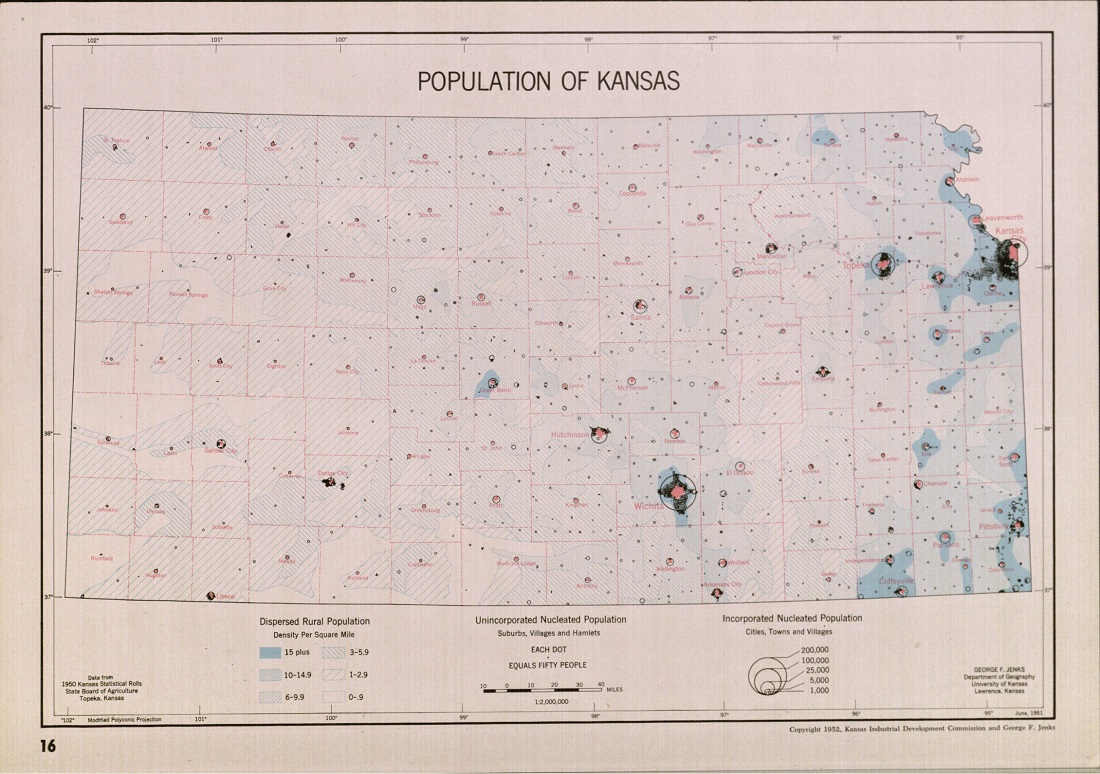
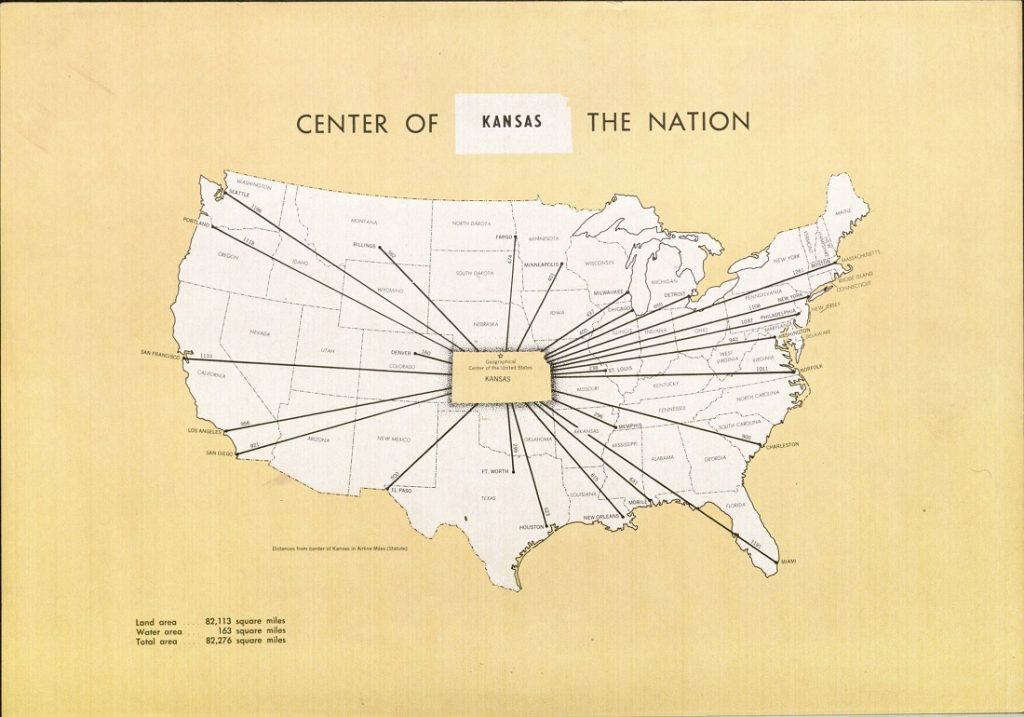
Jenks spent much of the 1950s producing statistical maps of Kansas. Representative examples of this work can be found in A Kansas Atlas (1952) and the maps he designed for the Kansas Industrial Development Commission. At a time when most state mapping agencies were either nascent or nonexistent, having a cartographer of Jenks’ caliber proved to be a boon for both the state and private industry. A Kansas Atlas was a rarity upon publication: a multi-color in-depth statistical atlas devoted to a single state. Jenks mapped an exhaustive variety of topics, ranging from population dynamics to agricultural productivity, using a variety of cutting-edge symbolization techniques. It should be noted that Jenks pioneered or fine-tuned many of the map symbolization methods used in this atlas and still in use to this day.
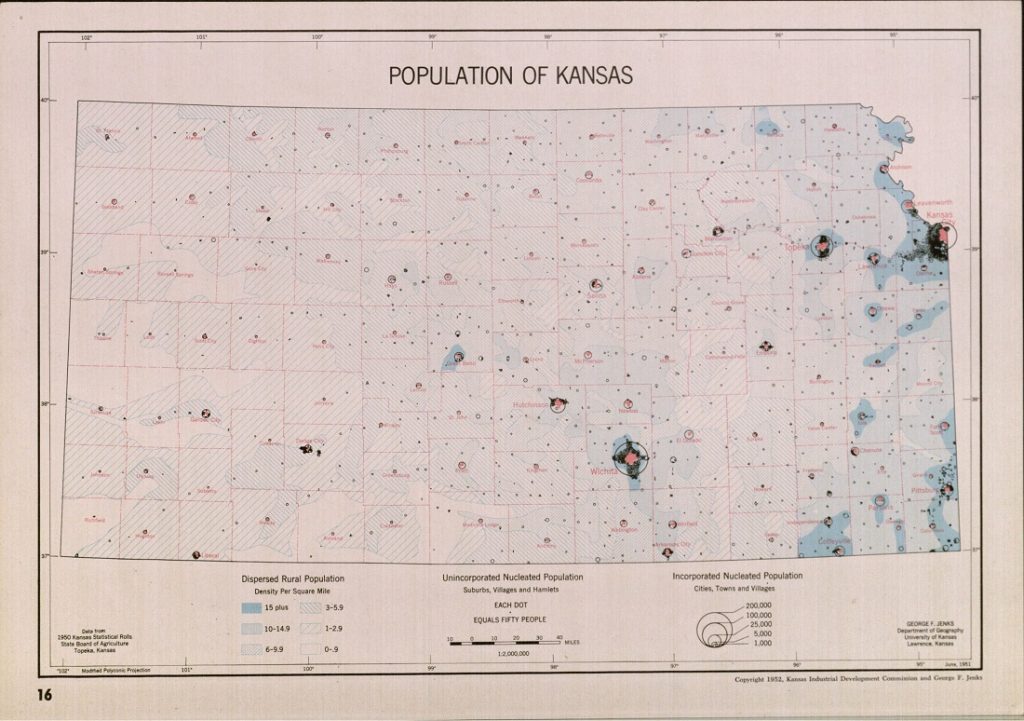
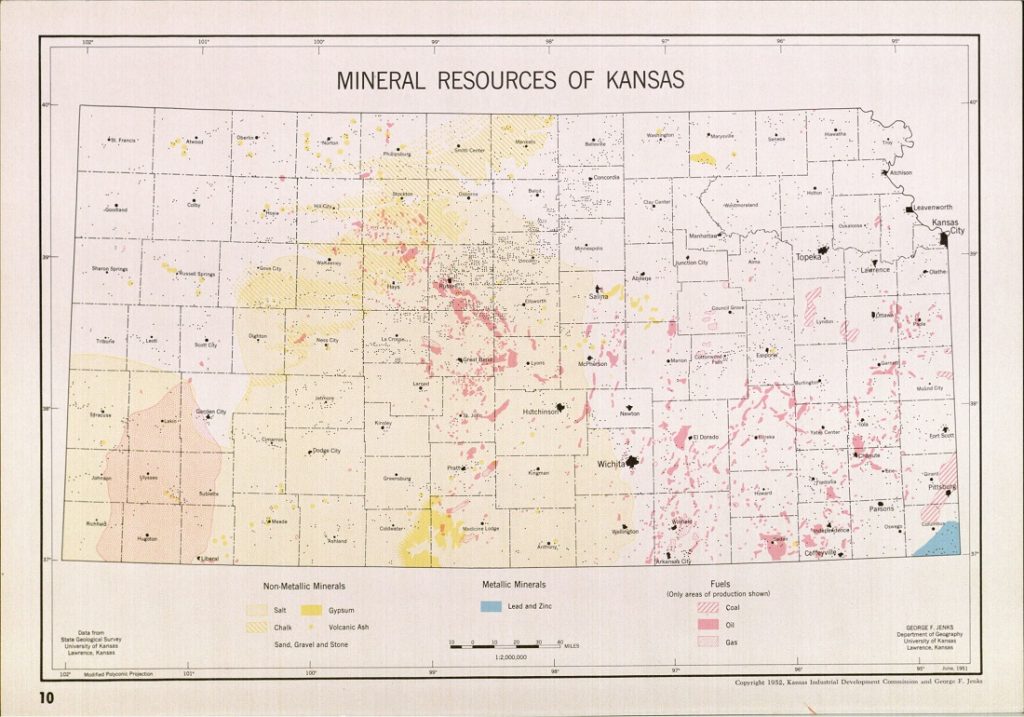
Selected maps from A Kansas Atlas (1952).
George F. Jenks Map Collection. Click images to enlarge.
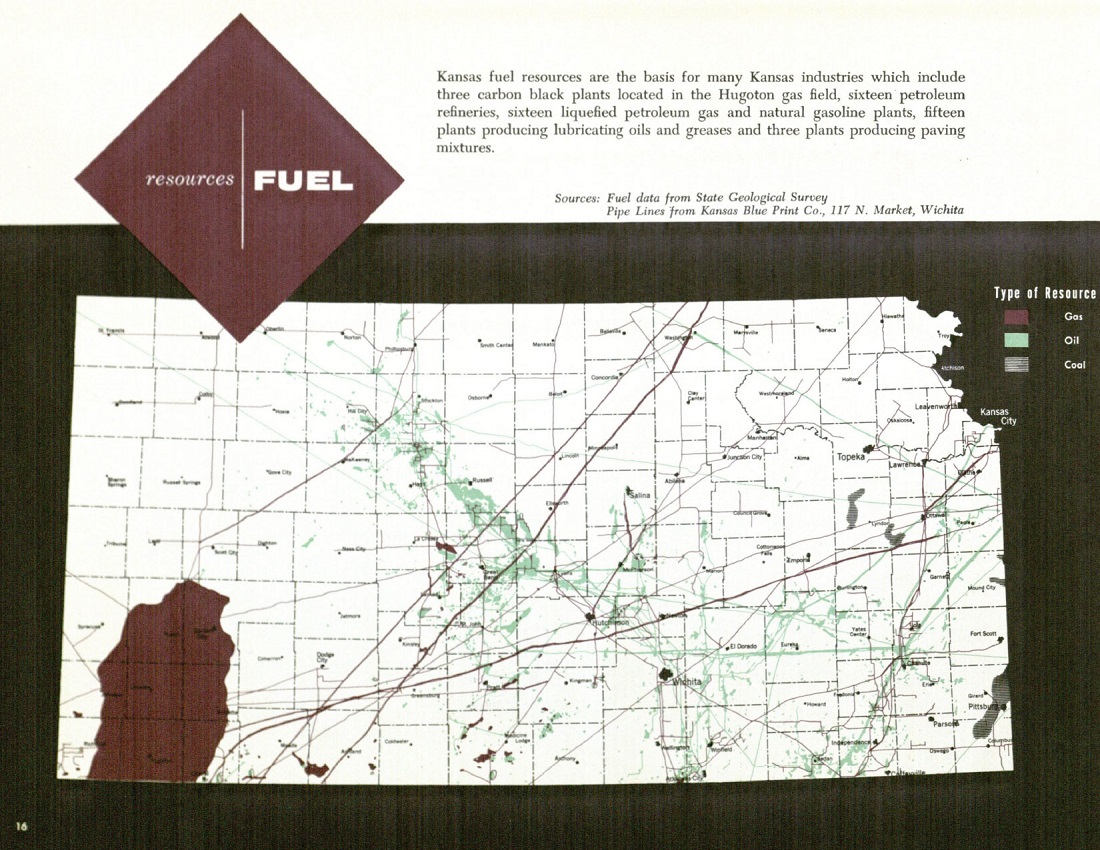
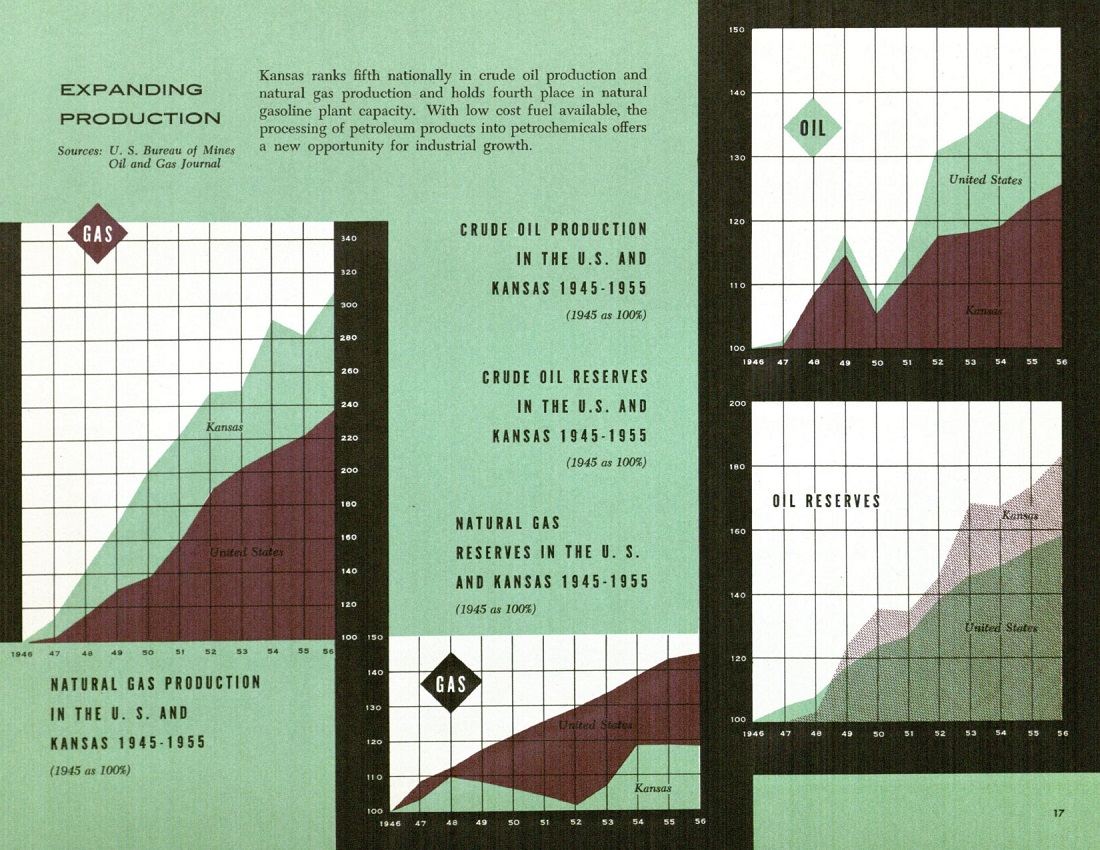
The Kansas Industrial Resources atlas (1956) is a masterclass in two-color map design and artful cartographic generalization. Jenks took mundane topics such as railroad freight service and electricity grids and simplified them to create visually arresting, statistically accurate maps. This is no small feat: to this day mapmakers struggle with the challenge of generalizing data so that important information stands out while preserving the accuracy of that information.
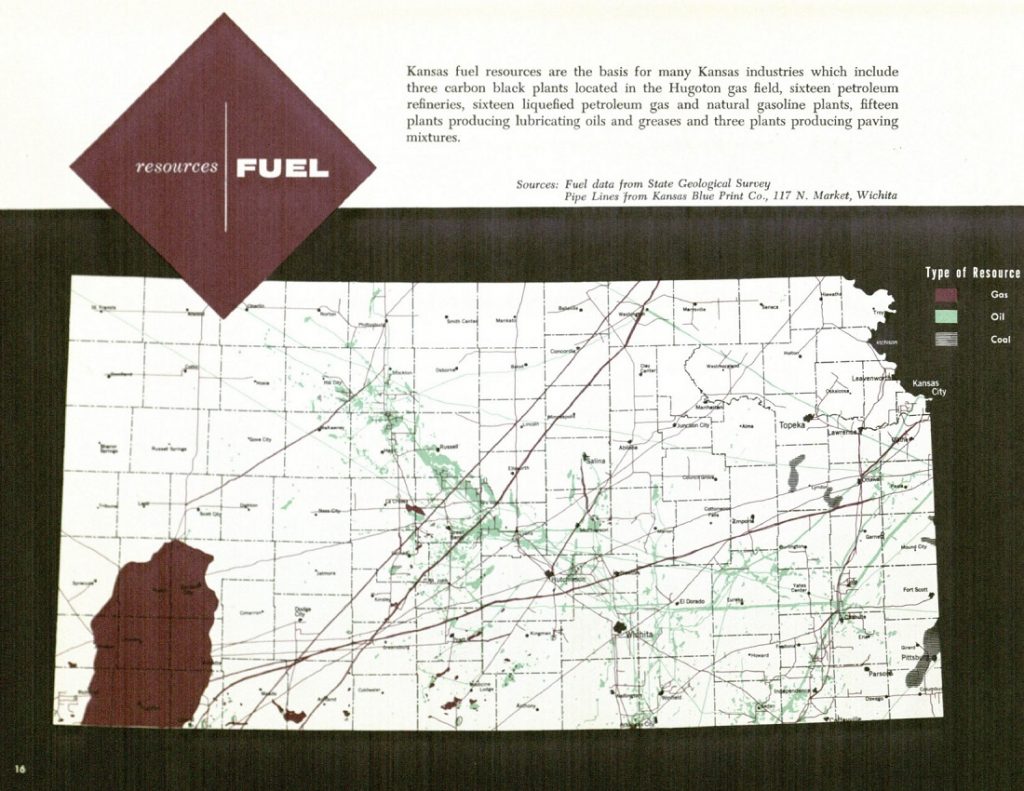

Fuel resources map spread, Kansas Industrial Resources (1956).
George F. Jenks Map Collection. Click images to enlarge.
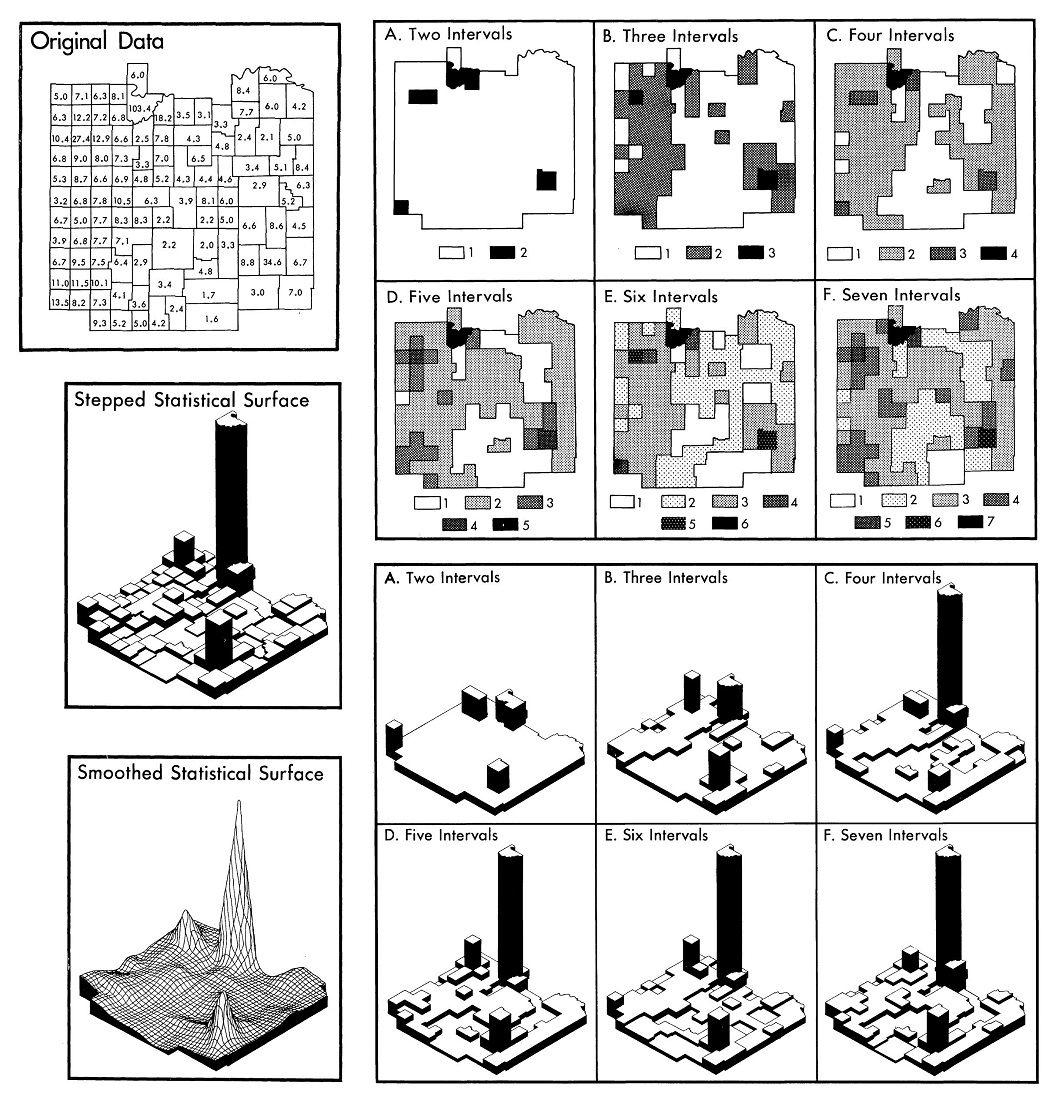
Generalization was a key theme of Jenks’ research in the 1960s and 1970s. Two of his publications, “Generalization in Statistical Mapping” (1963) and “Class Intervals for Statistical Maps” (1963), remain staples in the cartographic literature. Through this research, Jenks helped to systematize the process for classifying spatial data and devised rules to guide the selection of effective classification methods. The collection contains the maps and graphics Jenks created to illustrate these concepts, many of which are still used in cartography textbooks. Examples from his 1963 articles are below. Also included in the collection are hundreds of the maps he used in in his various generalization experiments.

Graphics from “Class Intervals for Statistical Maps” (1963) illustrating the
process of data generalization. Different class intervals affect the appearance of the
data on the map. George F. Jenks Map Collection. Click image to enlarge.
Another staple of Jenks’ work are three-dimensional map. Starting in the mid-1960s until the end of his academic career, Jenks refined three-dimensional mapping techniques, first by hand and later using computers. He recognized the potential of representing spatial phenomena in three dimensions, running many experiments and publishing many papers exploring the issue. One publication, “Three Dimensional Map Construction” (1966), remains highly recognizable within cartographic circles, and it also featured one of Jenks’ most famous maps: a three-dimensional representation of population density in central Kansas.
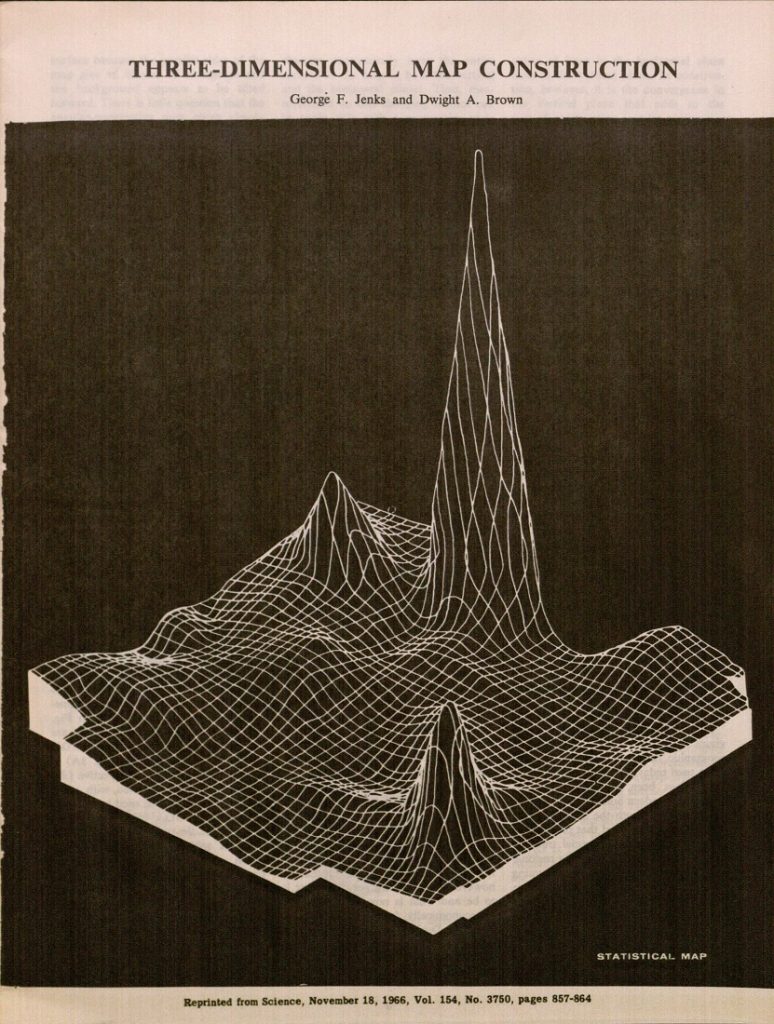
A three-dimensional “smoothed statistical surface” map representing
population density in central Kansas. This graphic graced the cover of the
November 18, 1966 issue of Science. Jenks originally created this graphic for his
class intervals research. George F. Jenks Map Collection. Click image to enlarge.
This post only skims the surface of Jenks’ celebrated career and barely hints at the contents of the Jenks Map Collection. Readers should keep in mind that while many of the maps featured in this post may not appear noteworthy by today’s standards or software capabilities, they were considered at the cutting edge in their time. Perusing both his personal papers (also maintained at Spencer Research Library) and this map collection reveals the breadth and depth of his cartographic expertise. Jenks was an innovator in many areas; in addition to his aforementioned research interests, he was also recognized as an expert in the areas of curriculum design, cartographic reproduction techniques, and the links between cartography, psychology, and human factors. The Jenks Map Collection preserves a wide assortment of the preliminary and production artwork underpinning his academic and professional careers. The collection finding aid is undergoing finalization and should be published to the Spencer Research Library website in the coming months.
Travis M. White
Special Collections Cartography Intern and 2018 KU graduate (Ph.D., Geography)
References
Jenks, George. (1952). A Kansas Atlas. Topeka: Kansas Industrial Development Commission.
Jenks, George. (October 1956). Kansas Industrial Resources. Topeka: Kansas Industrial Development Commission.
Jenks, G. F. (1963). Generalization in statistical mapping. Annals of the Association of American Geographers, 53(1), 15-26.
Jenks, G. F., Coulson, M. R. C. (1963). Class intervals for statistical maps. International Yearbook of Cartography. 119-134.
Jenks, G. F., Brown, D. A. (November 1966). Three-dimensional map construction. Science. 154(3751), 857-864.

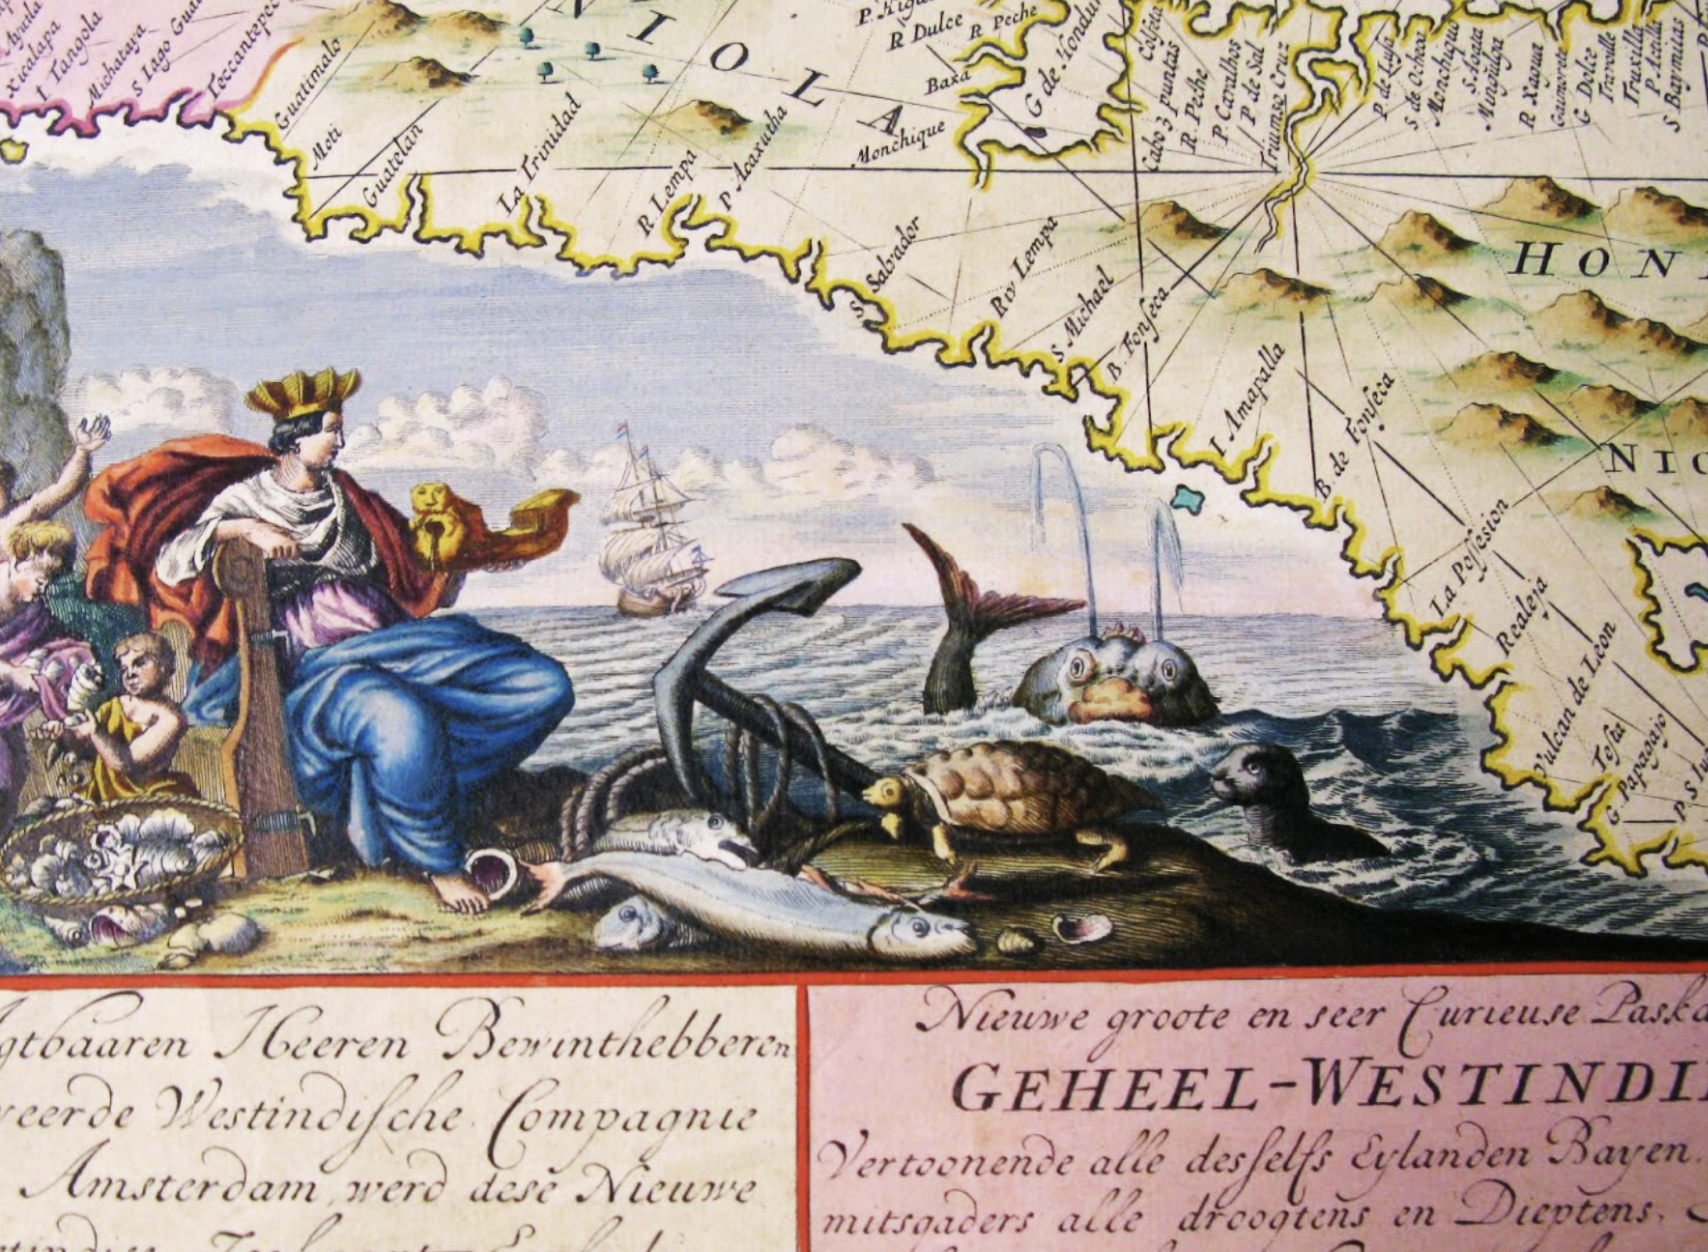
![Full view of the map Nova totius terrarum orbis tabula Amstelaedami...by Frederik de Wit, [173-]. Call Number: Orbis Maps 1:5.](https://blogs.lib.ku.edu/spencer/wp-content/uploads/2024/10/Orbis-Maps-1.5-B.png)